NCERT Solutions
RD Sharma Solutions for Class 8 Maths Chapter 24
RD Sharma Solutions for 8 Class Maths Chapter 24 - Data Handling – II (Graphical Representation of Data as Histogram)
RD Sharma solutions for Class 8 Maths Chapter 24 - Data Handling – II (Graphical Representation of Data as Histogram) are available here. Our expert faculty has devised a solution to help you prepare your exams to get good marks in math. If you want to get an excellent score then it is very important to solve Ardi Sharma Class 8 Solutions. This chapter mainly describes problems based on the representation of rational numbers, total numbers, natural numbers, and rational numbers on the number line. To help you understand and solve problems, at ExamExxpert we have designed RD Sharma Class 8, where the solutions are addressed in detail.
Download Chapter: 24 in Pdf
RD Sharma Solutions for Class 8 maths chapter 24 in Pdf Download
Download RD Sharma Solutions for class 8 maths in pdf format at ExamExxpert.com and strengthen your mathematical concepts with ease. We have uploaded RD Sharma solutions in a modified format for the convenience of the students. With the help of these solutions, students can easily understand the whole concept and solve chapter-wise problems to achieve good marks. The RD Sharma solution for Mathematics of ExamExxpert 8th class is free of charge and students can download it at their convenience. These solutions are written by our well-qualified mathematicians and therefore you can easily use them without considering any doubts.
RD Sharma Solutions for Class 8 Maths Chapter 24 – Data Handling – II (Graphical Representation of Data as Histogram)
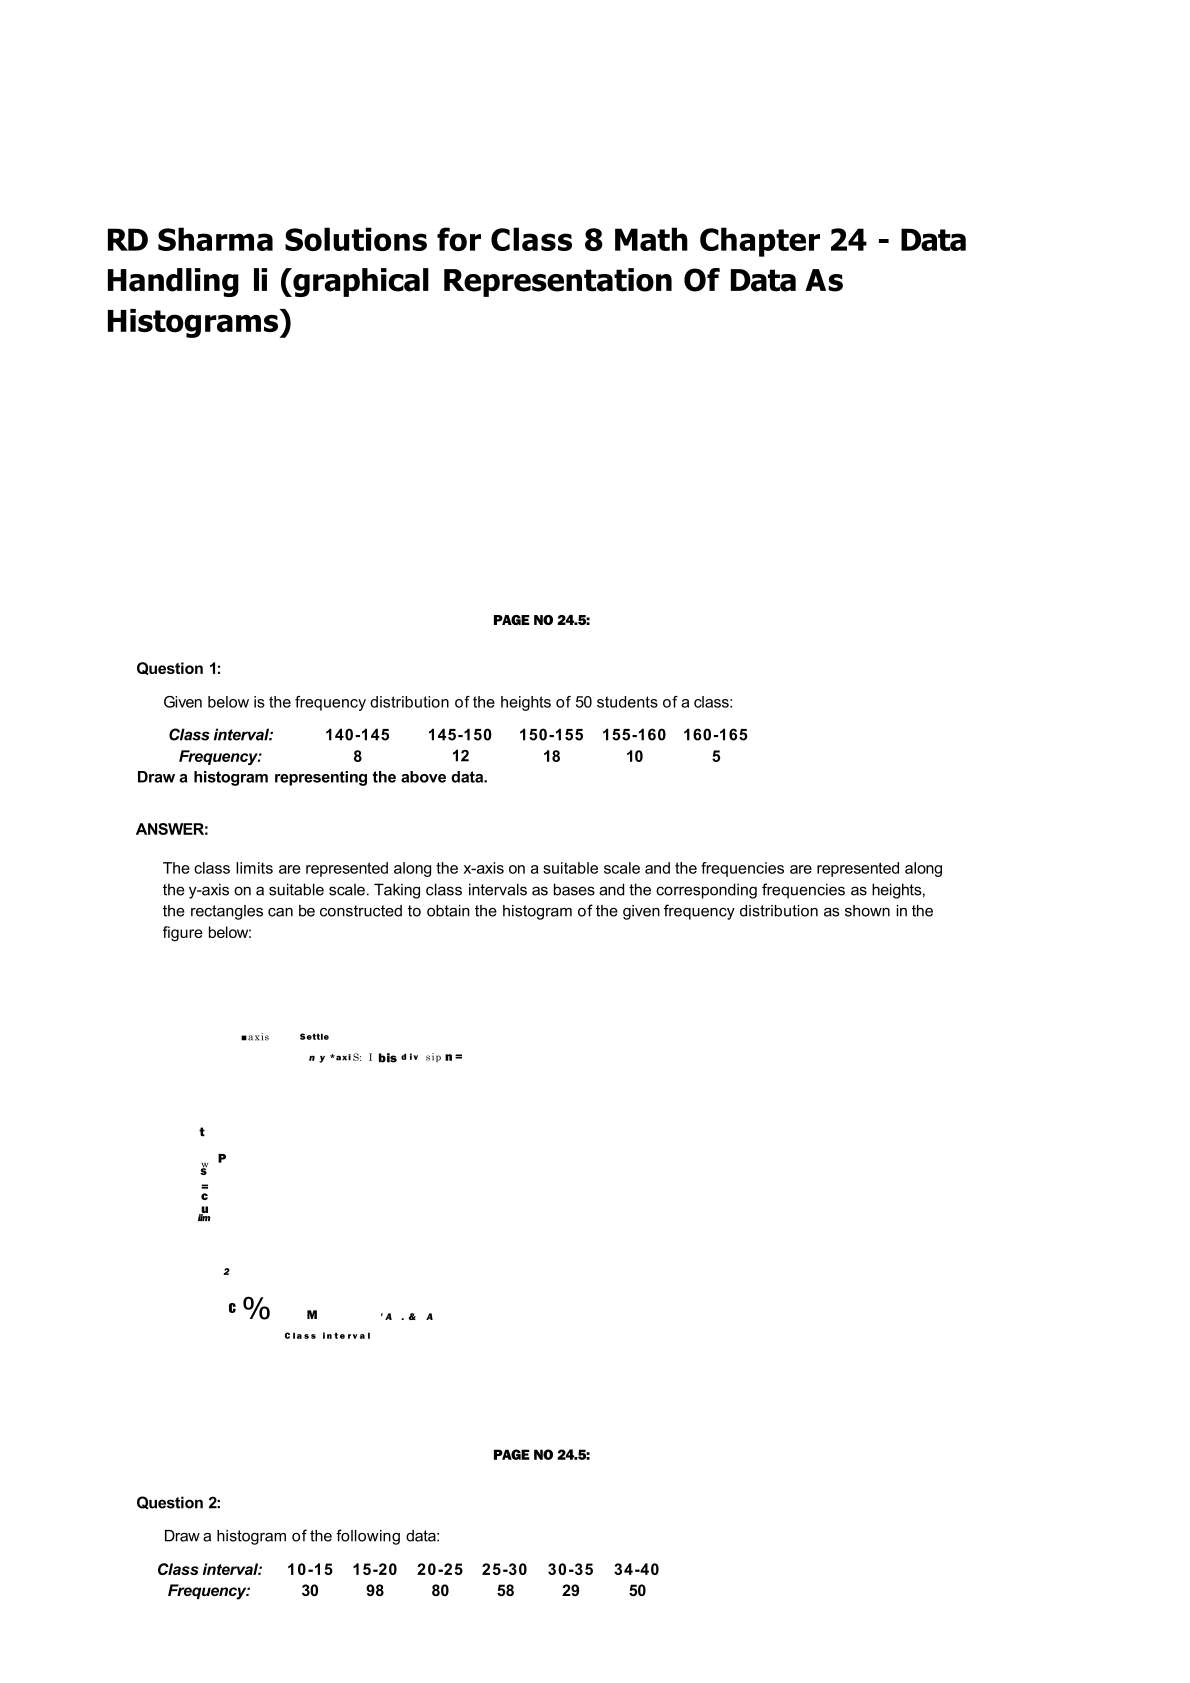
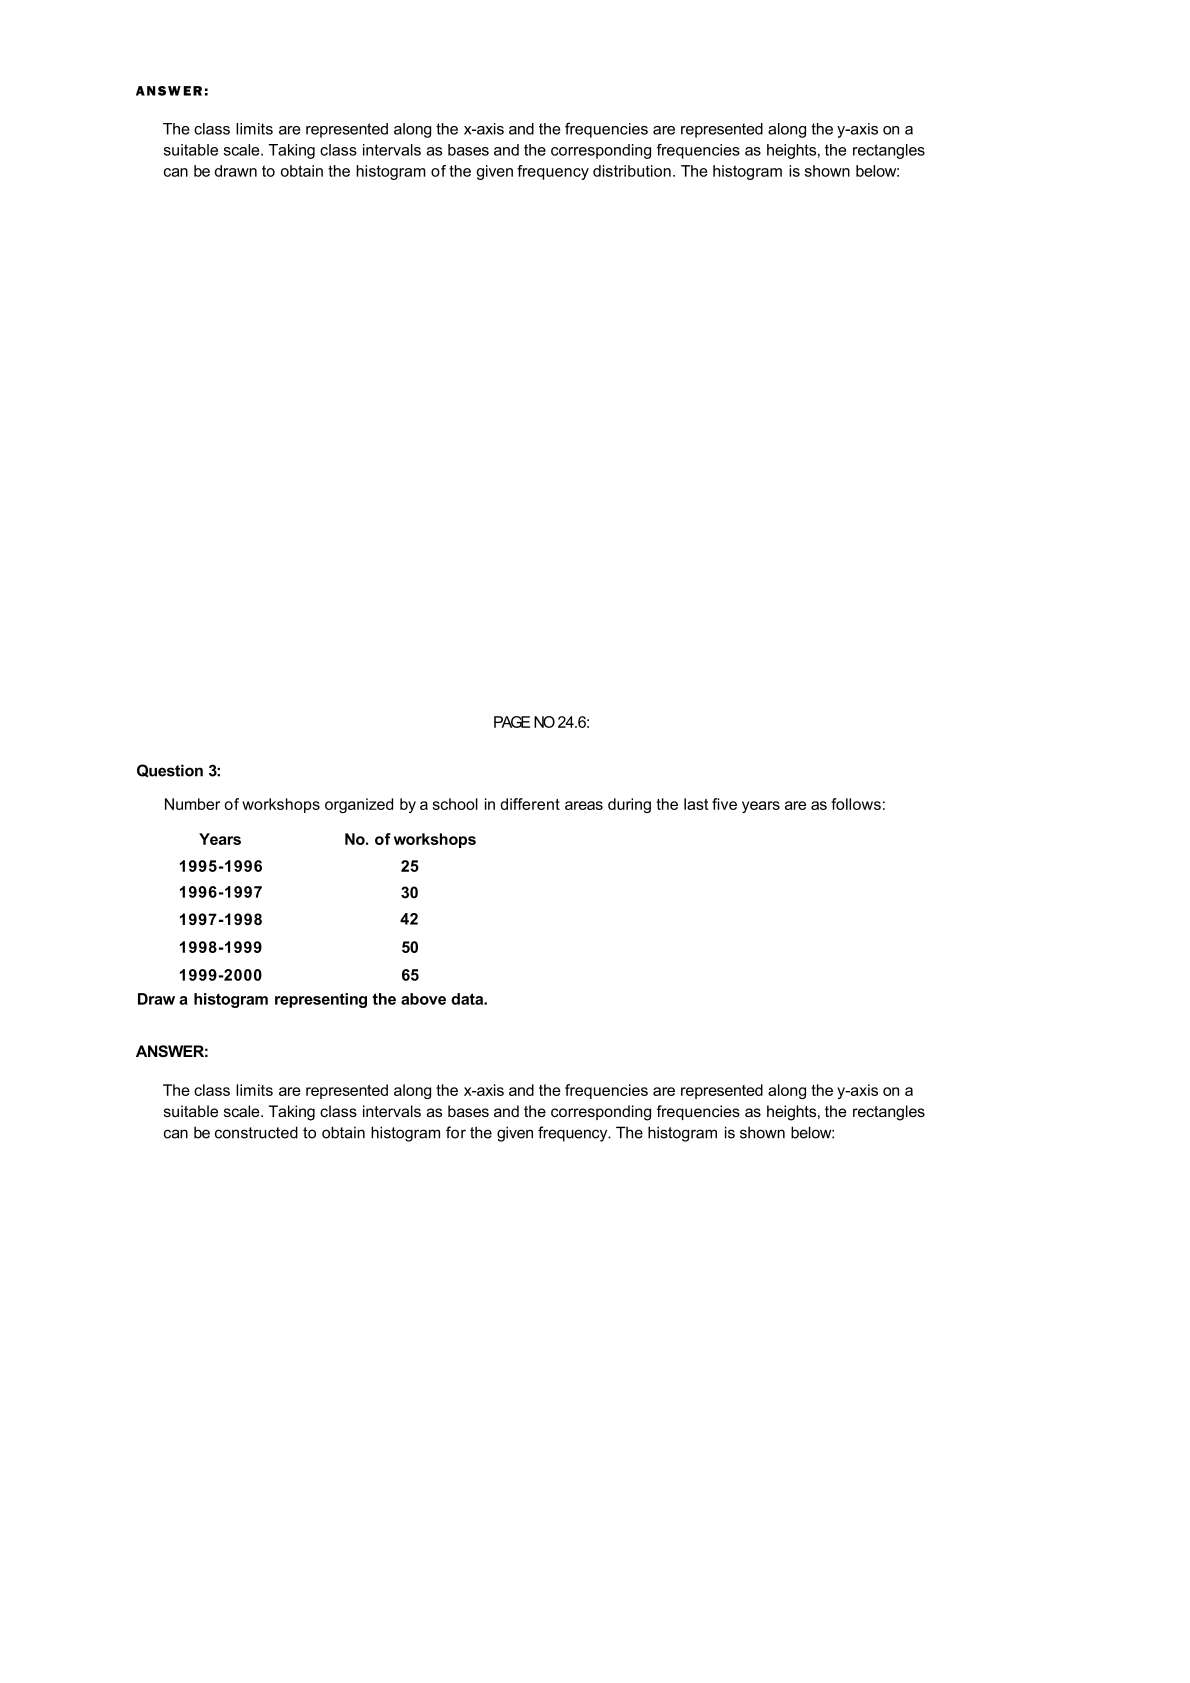
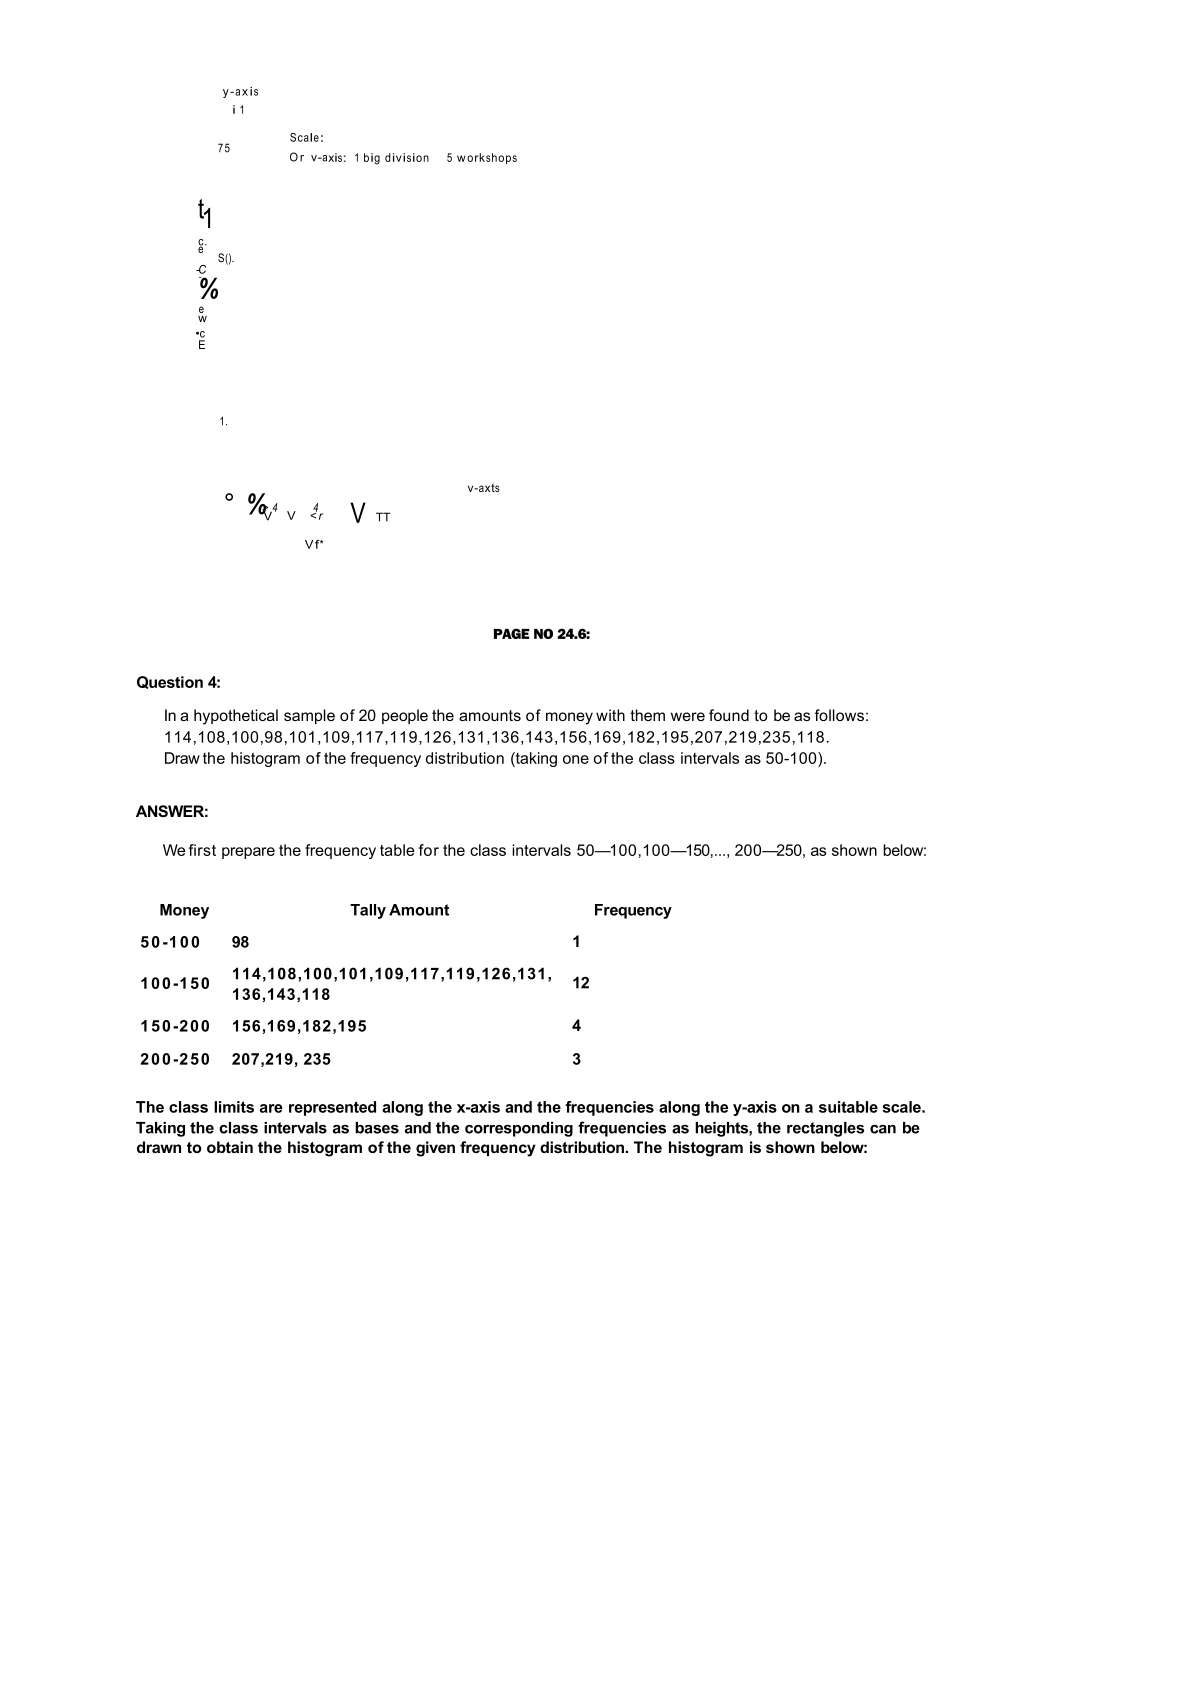
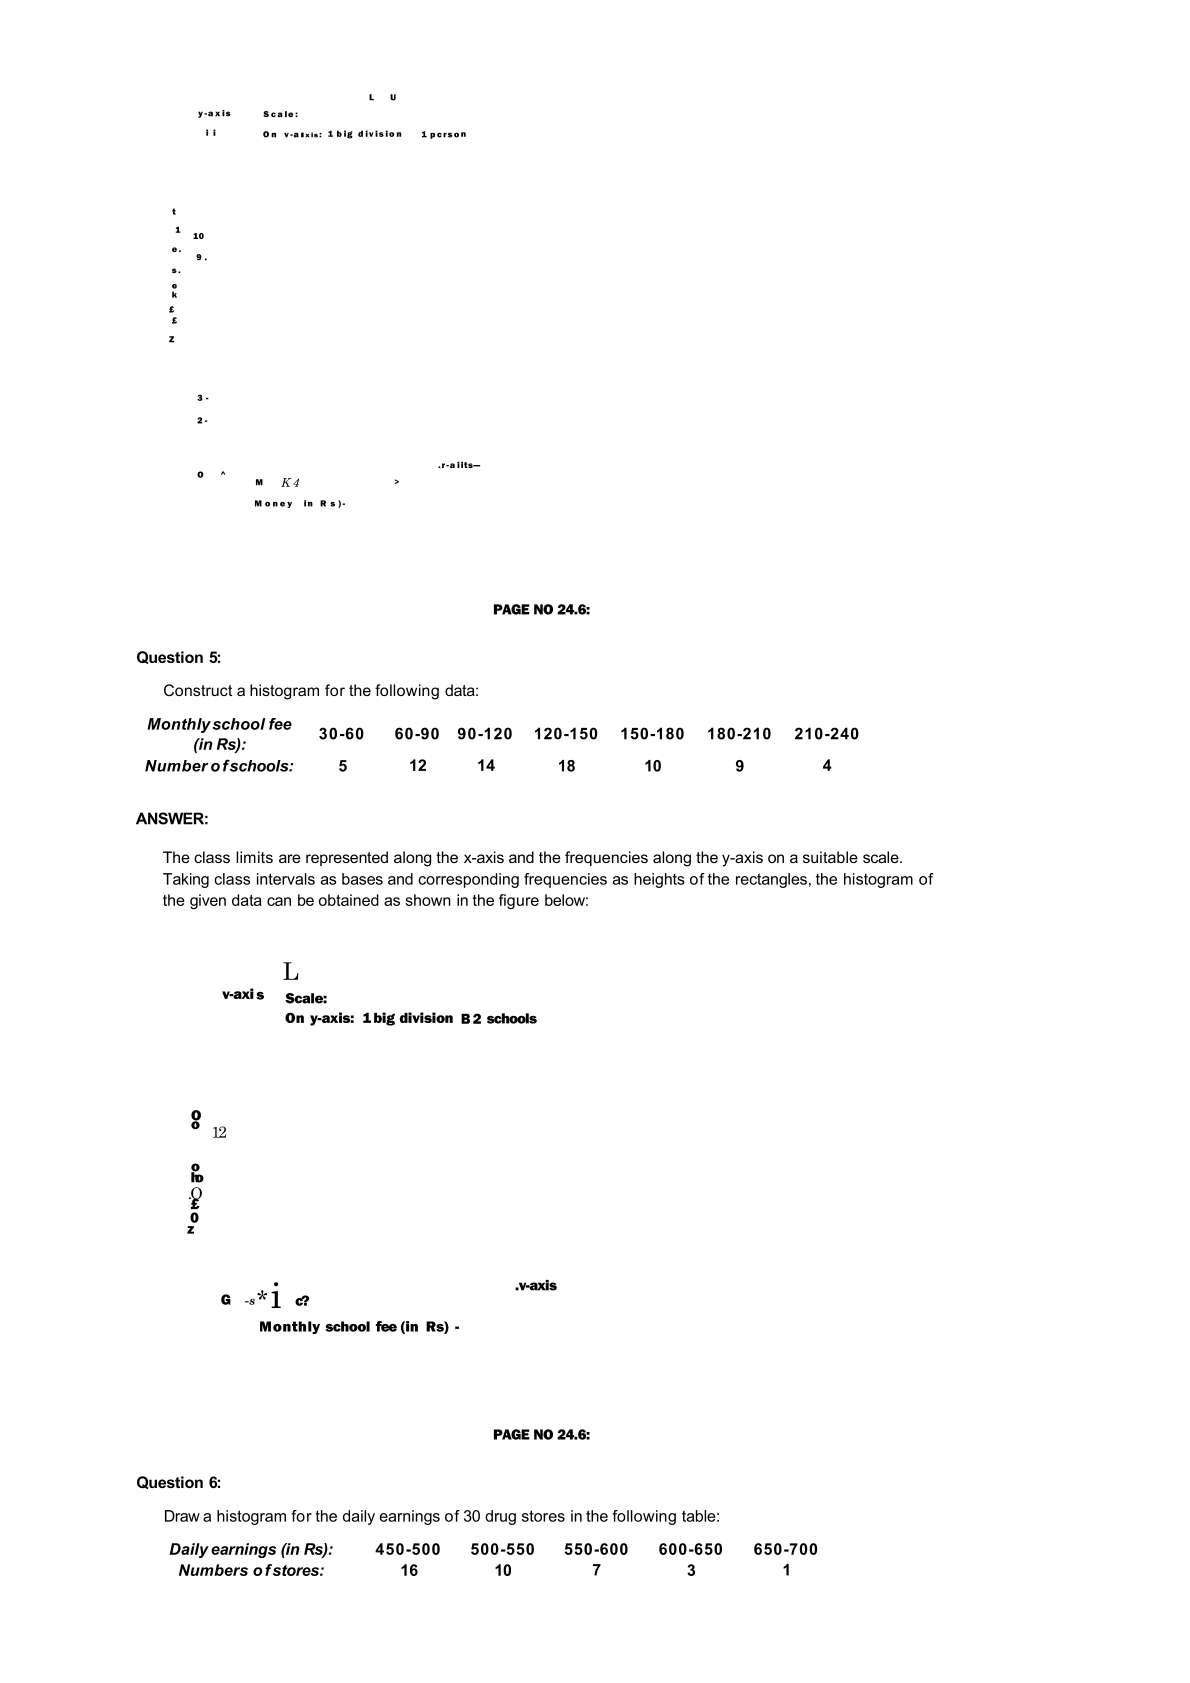
In previous classes, we learned how to create bar graphs to represent the frequency distribution of arbitrary data. In this section, we will learn how to graph the group frequency distribution. The most common graphic representation is the histogram.